← All projects

A project for Peru · non-profit

See the risk of landslides and floods before they arrive.

A project 100% for Peru: preventing harm and protecting people. With open-source software I simulate what El Niño rains would do, where the water would flow and who it would reach, and I put it on a map anyone can open.

Non-profitOpen data and codePrototype in development

Video from the ARNAI LAB channel (in Spanish). Ate, Lima.

Competition

I'm applying with this project to MIT Solve 2027, Global Climate Challenge.

13
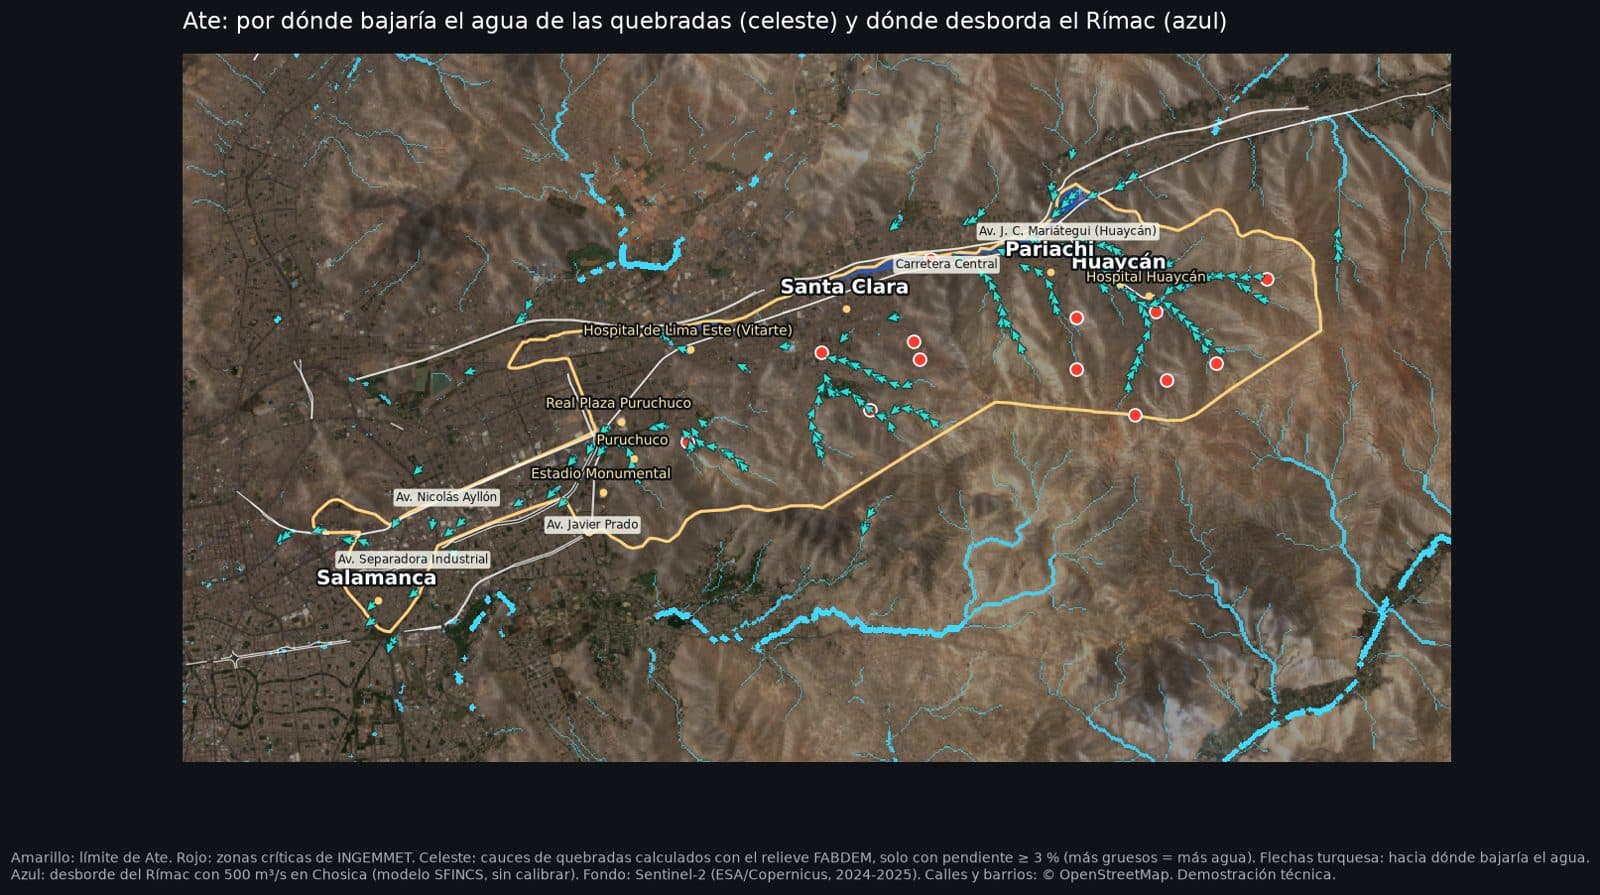
official huaico critical zones in Ate (INGEMMET)
~50,800
people live within 60 m of a ravine in Ate
~725K
residents in Ate
94%
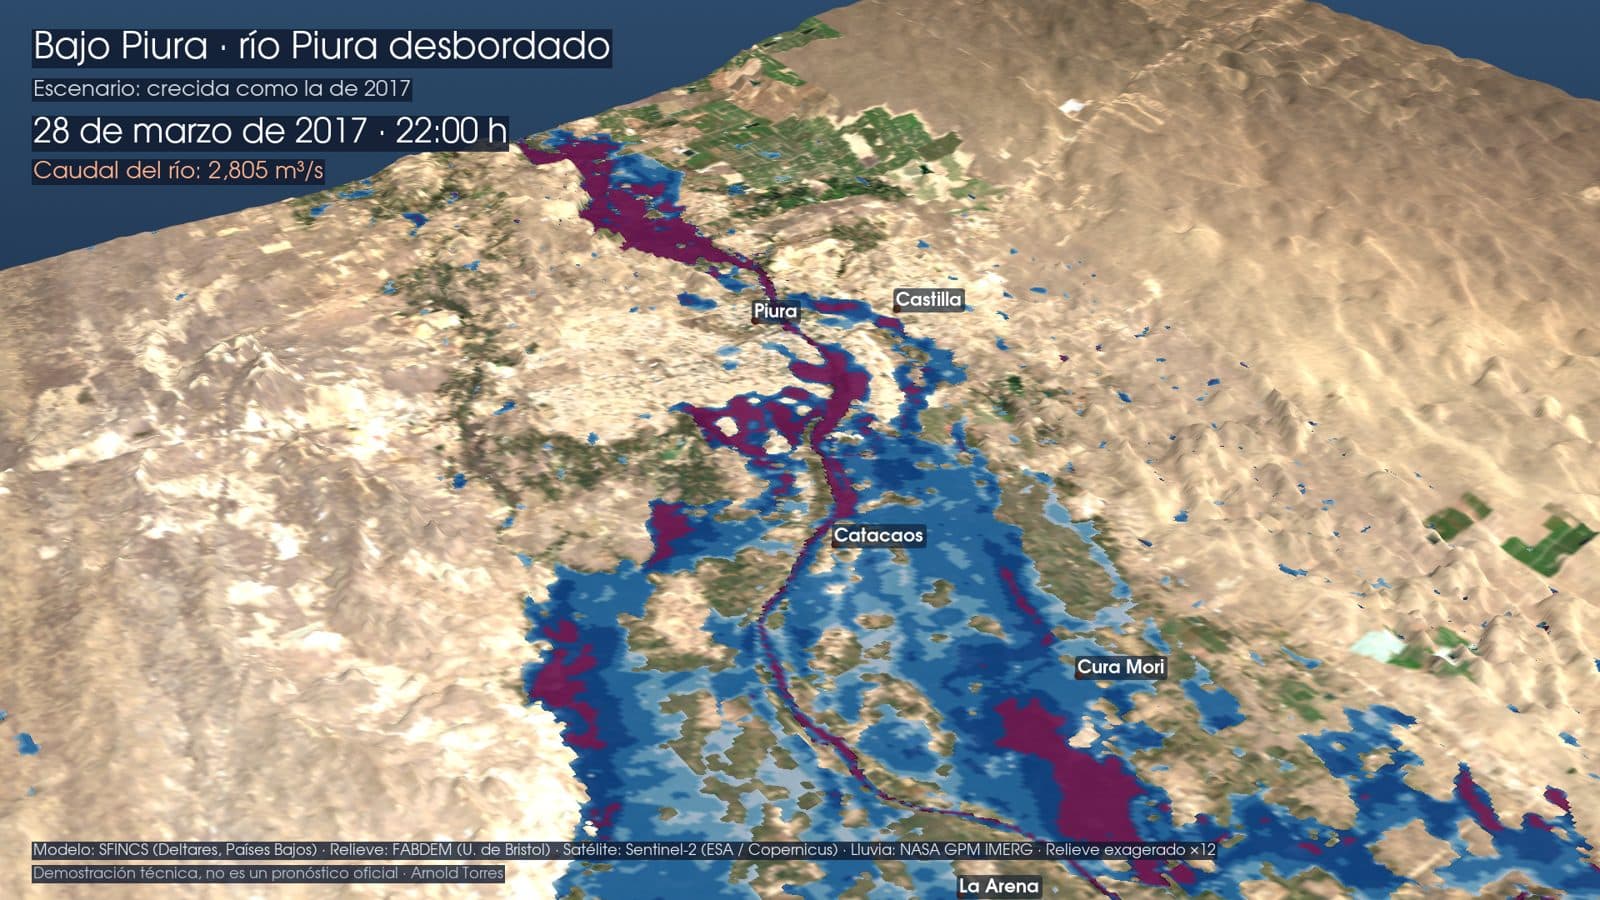
match with the satellite in Piura 2017, after calibrating with 2017 and 1998

01/Why

Peru plans with susceptibility maps. What's missing is seeing the water move.

Public agencies publish maps of exposed areas, but they don't simulate how water moves street by street. For summer 2027, CENEPRED estimates more than 1.6 million people at high or very high flood risk in Lima alone. This project fills that gap: an open hydraulic simulation, built with the same technology the Netherlands uses, so neighbors, schools and municipalities can see their area.

Source for the figure: CENEPRED, risk scenario study for summer 2027 rains (August 2026). It is exposure from susceptibility maps, not a hydraulic model.

02/How it works

Official data, open simulation and a map for everyone.

  1. 01

    Official and open data

    Rainfall from SENAMHI, NASA and PISCO; terrain from FABDEM; critical zones from INGEMMET; ESA satellite imagery and OpenStreetMap streets.

  2. 02

    Water simulation

    With SFINCS, Wflow and HydroMT, open-source software from Deltares (the Netherlands), I compute how water leaves the basin and how much each area gets, hour by hour.

  3. 03

    A map anyone can open

    Search your street and see whether the water would reach it, how strongly and from where. No sign-up, no cost, from your phone.

03/Where it's tested

Piura to validate. Ate to prevent.

3D render of the Piura river overflowing in the 2017 flood scenario
Validation · Lower Piura

First, check that the model gets it right.

I reproduced the March 2017 Coastal El Niño and compared the flooded area with Sentinel-1 satellite images. The model matches 94%, calibrated with the 2017 and 1998 floods. That is what makes the future scenarios trustworthy.
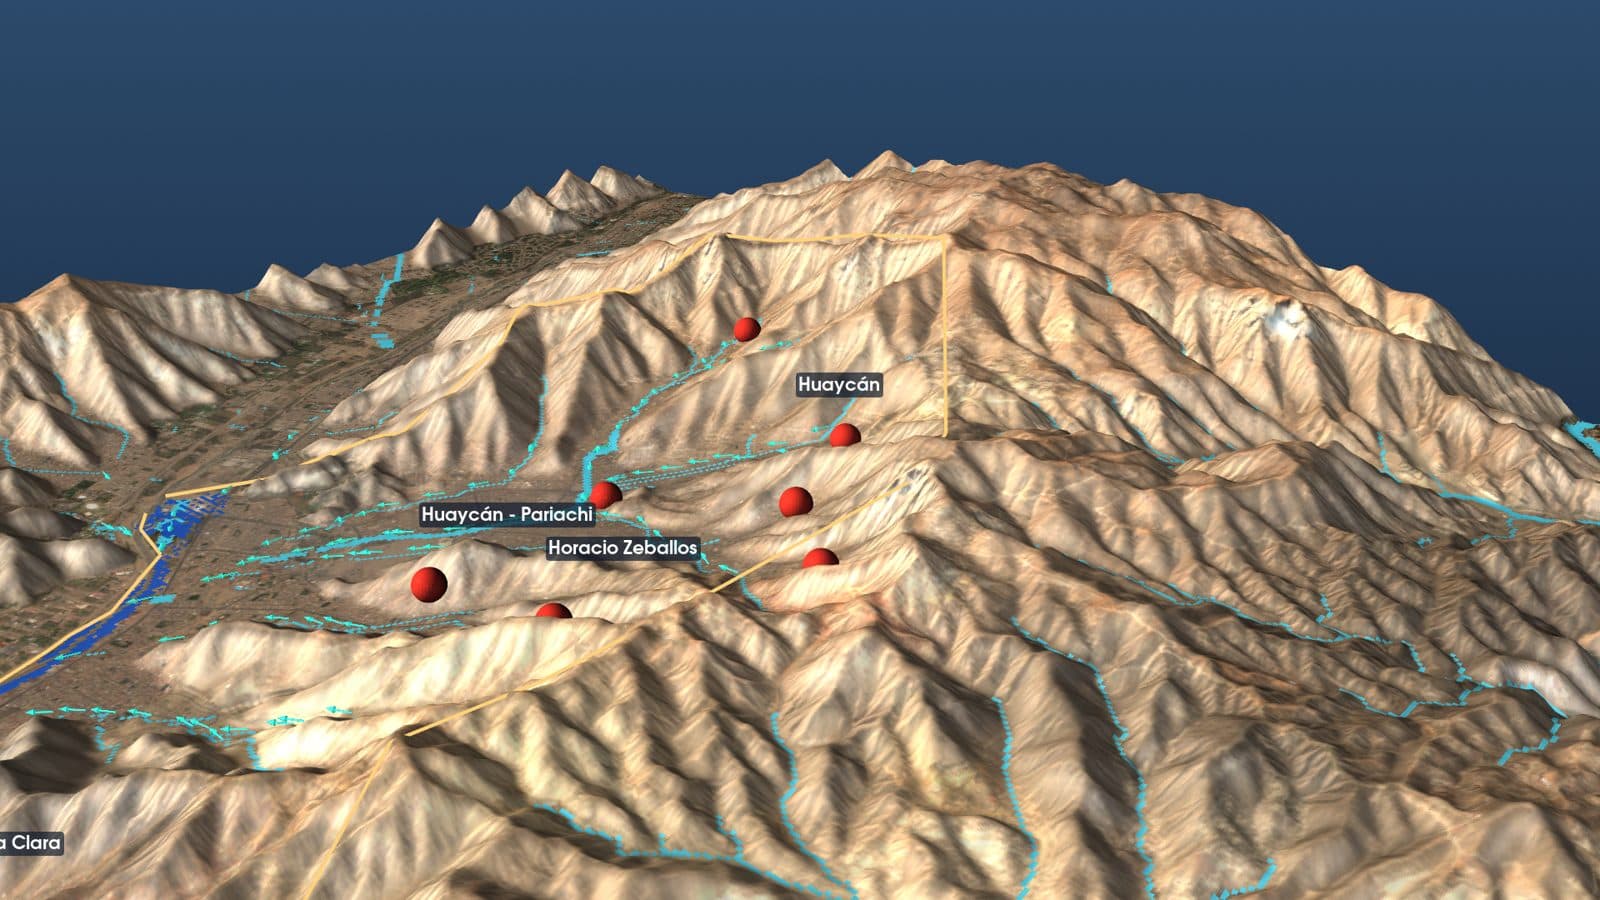
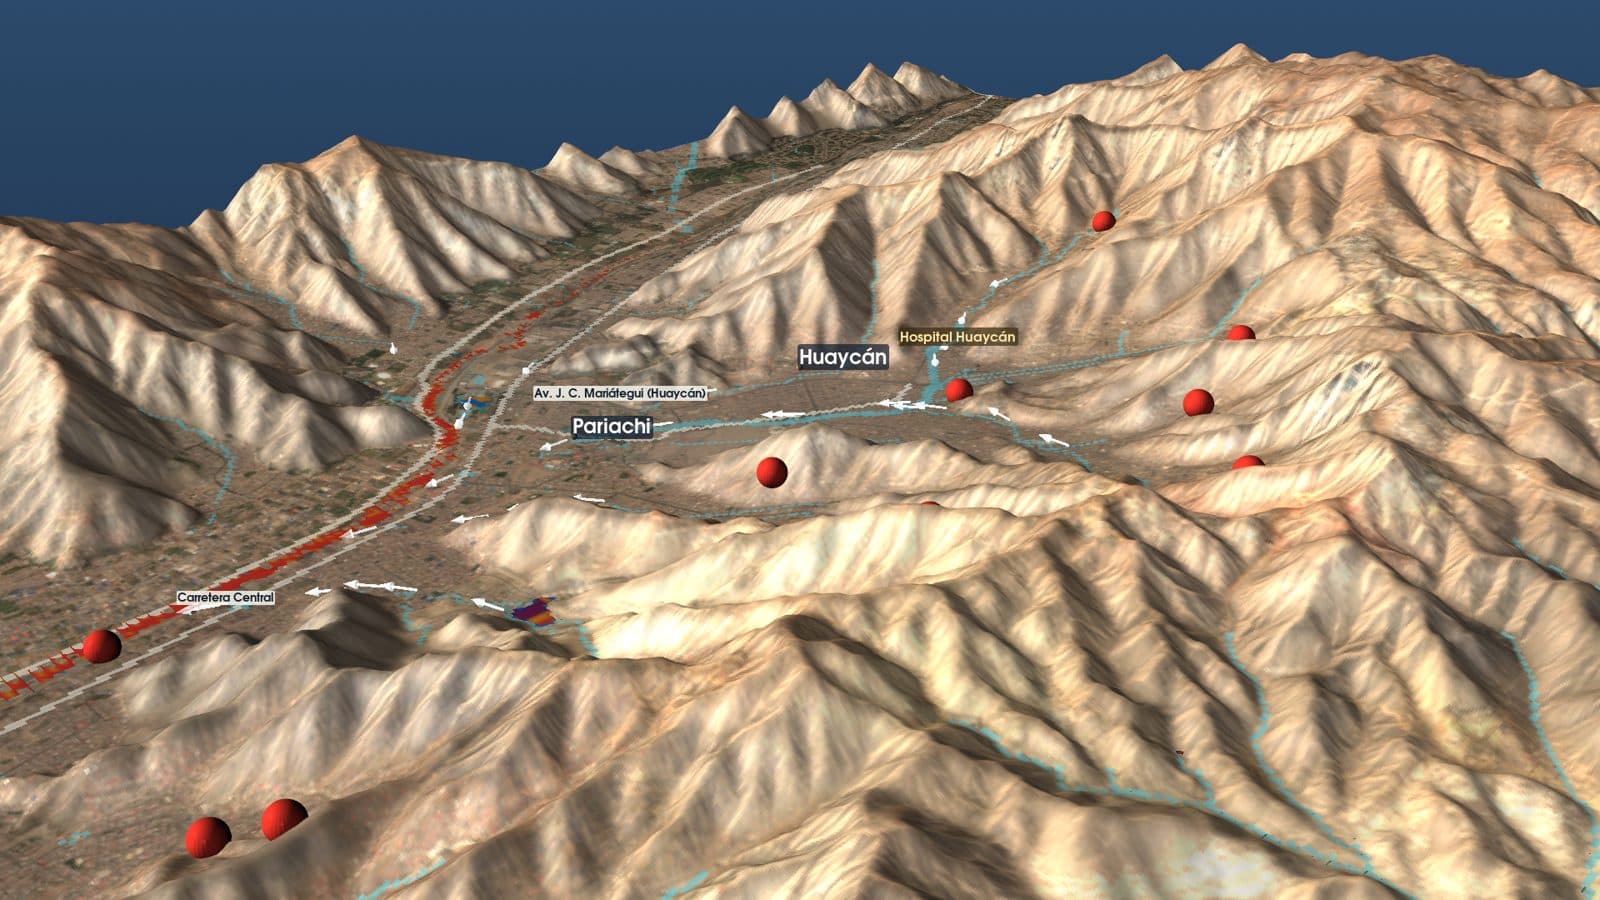
3D view of the Huaycán ravines in Ate with the official critical zones marked
Prevention · Ate, Lima

Ate's ravines and the official critical zones.

Ate has 13 huaico critical zones registered by INGEMMET. I traced where water flows down from the ravines and counted how many people live next to them: about 50,800 within 60 m of a channel.

3D simulation of an intense downpour over Ate with water shown over the streets
Scenario · downpour in Ate

What happens with the official design rainfall.

With the official 100-year return rainfall (24 mm in 3 hours), about 3,700 people would be where the water is strong enough to sweep an adult off their feet. It is water only: a real huaico also carries mud and rocks, with more volume and force.

What it is and what it isn't

  • It is a technical demonstration and a prototype, not an official forecast or an alert.
  • Ate is not yet calibrated with measured flows; Piura is validated with 2017 and 1998.
  • The simulated water carries no mud or rocks, so it understates a real huaico.
  • In an emergency, official information comes from INDECI, SENAMHI, ENFEN and CENEPRED.
Map of Ate with ravines, critical zones and flooded areas

04/Open

The code and the data are for the country to use.

The Piura 2017 model is published under an open license. Results are for non-commercial use, because they depend on terrain data with that license. If you work for a municipality, a school, a university or a public agency and want to see your area, write to me.

Credits

Software: SFINCS, Wflow and HydroMT (Deltares, the Netherlands). Terrain: FABDEM (University of Bristol). Satellite: Sentinel-1 and Sentinel-2 (ESA / Copernicus). Rainfall: NASA GPM IMERG and PISCO (SENAMHI). Critical zones: INGEMMET. Risk scenarios: CENEPRED. Streets and places: OpenStreetMap. Population: WorldPop. Stations: SENAMHI.

Want your area to be next?

The project moves city by city. If you know a municipality, a school or a neighborhood where it would help, tell me.

Message me on WhatsApp →